LogoLine Graph Maker
HomeAboutContactPrivacyTerms
90 seconds from data to line chart • No sign-up • Data stays in your browser

Choose how you want to start your line chart

Already have data ready, or prefer a guided setup? Pick the path that matches your task and we'll configure the line chart maker for you.

Fast path

I already have my data

Paste or upload your CSV, and we'll auto-detect the time axis and series to build a clean line chart instantly. Ideal for quick reports and one-off tasks.

  • • CSV paste or file upload
  • • Smart detection of dates and numeric columns
  • • Sensible defaults so you can export in seconds
Guided path

Help me pick the right style

Tell us where this chart will be used, and we'll pre-configure themes and export settings so it looks right in context.

Common scenarios

📊 Report / PPT🎓 Assignment / paper📱 Social post
  • • Preset themes tuned for each scenario
  • • Export defaults for PPT, print, or social feeds
  • • Still fully editable after the initial setup

Loading Chart Maker...

FAQ

Frequently Asked Questions

Everything you need to know about our line graph maker.

Yes! All data processing happens entirely in your browser. Your data never leaves your device and is not sent to any server.

Still have questions?

Can't find the answer you're looking for? Feel free to reach out to our team.

Start Creating Your Chart
LogoLine Graph Maker

Build polished line charts in minutes—Line Graph Maker equips analysts and storytellers with intuitive tools to design, refine, and share data-driven visuals.

SOC 2 Type 2 Certified
Contact us

Company

  • Privacy Policy
  • Terms & Conditions

Resources

  • Home
  • Line Chart Types

Guides

  • Blog
LanguageChoose your preferred language
🇺🇸EnglishCurrentDefault🇨🇳简体中文🇹🇼繁體中文🇪🇸Español🇧🇷Português

© 2026 Line Graph Maker, Inc. All rights reserved.

Free • No Sign-up • Privacy-First

Create Beautiful Line Charts in Seconds

Free online line graph maker and line chart maker. Paste your data, customize styles, and export high-quality line charts. No sign-up required and all processing happens in your browser.

✓ CSV Import
✓ Multiple Chart Types
✓ PNG/SVG Export
✓ Full Customization

Line Chart Examples & Templates

Browse through our collection of 27+ professional line chart and line graph templates you can use directly in our line graph maker. From basic trends to advanced visualizations.
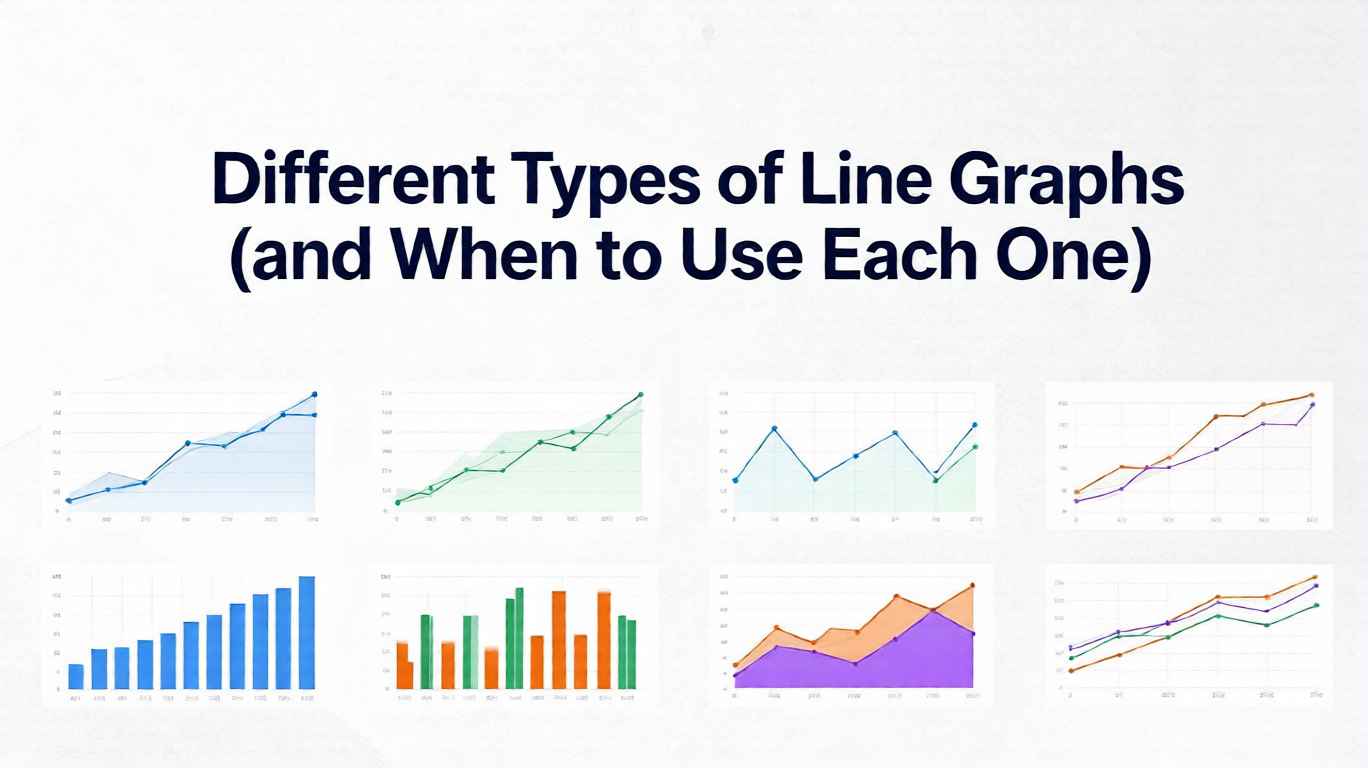
Basic Line

Basic Line

Basic

A standard single/multi-series line chart to show trends over an ordered domain.

line charttrendseries+2
Smoothed Line

Smoothed Line

Basic

Curved lines emphasize overall tendencies while trading off exact extrema.

smooth linecurvespline+2
Step Line

Step Line

Basic

Stair-step transitions highlight discrete changes and hold periods.

step linestairdiscrete change+1
Basic Area

Basic Area

Basic

Fill under a line to emphasize accumulated magnitude and visual density.

area chartfillmagnitude+1
Stacked Area

Stacked Area

Intermediate

Multiple series stacked to show composition over time or categories.

stacked areacompositionmultiple series+1
Area with Time Axis

Area with Time Axis

Intermediate

Temporal area pattern with date/time domain and readable tick formatting.

time seriesdatetimearea+1
Dynamic Line with Time Axis

Dynamic Line with Time Axis

Advanced

Live-updating time series with streaming or windowed data.

dynamicstreamingrealtime+2
Log Axis Line

Log Axis Line

Intermediate

Logarithmic scale reveals multiplicative growth and power-law behavior.

log axisorders of magnitudeexponential growth
Multiple X Axes

Multiple X Axes

Advanced

Two or more aligned x-axes to compare different units or granularities.

dual axismultiple axescomparison+1
Stacked Line

Stacked Line

Intermediate

Accumulate series vertically to compare totals without area fills.

stacked linecompositionmultiple series
Gradient Stacked Area

Gradient Stacked Area

Intermediate

Stacked area with gradient fills to emphasize composition transitions.

stacked areagradientcomposition
Area Pieces

Area Pieces

Advanced

Segment the area fill by value ranges for conditional emphasis.

area piecessegmentationthresholds
Explore All Chart Types

Latest from Our Blog

Discover tips, tutorials, and insights about line charts, data visualization, chart design, and best practices.

View all articles
Different Types of Line Graphs (and When to Use Each One)
Nov 24, 2025
Jacky Fan

Different Types of Line Graphs (and When to Use Each One)

9 Types of Line Graphs Explained: Simple, Multiple, Step, Smoothed, Area, Ribbon, Small Multiples, Sparklines & Polar — Learn exactly when to use each, avoid common pitfalls, and create clear, professional data visualizations.

line graph types
The Evolution of Statistical Graphics: From Bar Charts to Dashboards
Nov 17, 2025
Jacky Fan

The Evolution of Statistical Graphics: From Bar Charts to Dashboards

Trace the evolution of data visualization from Playfair to modern dashboards.

line graph history
William Playfair: The Rogue Genius Who Invented the Graphs You See Everywhere
Nov 9, 2025
Jacky Fan

William Playfair: The Rogue Genius Who Invented the Graphs You See Everywhere

Discover William Playfair, the forgotten genius who invented bar charts, line graphs, and pie charts in the 1780s. Explore his rogue life and lasting impact on data visualization.

line graph history
The History of Line Graphs: How One Scottish Engineer Changed Data Visualization Forever
Nov 5, 2025
Jacky Fan

The History of Line Graphs: How One Scottish Engineer Changed Data Visualization Forever

Explore the fascinating history of line graphs, from William Playfair’s 1786 invention to the digital visualization revolution.

line graph history
Explore All Articles
How It Works

Create Your Line Chart in 3 Easy Steps

Our free online line graph maker makes chart creation simple and fast.

1

Add Your Data

Paste CSV data or use our interactive table editor. Upload files or enter data manually.

2

Customize Style

Choose chart type, colors, fonts, and more. Preview changes in real-time.

3

Export & Share

Download as PNG or SVG. Copy to clipboard or embed in your documents.

Try it now - it's free